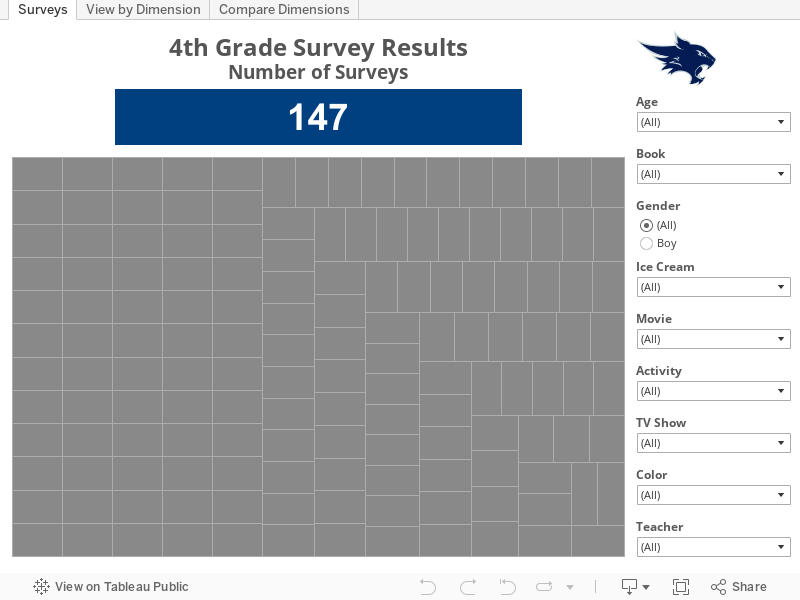
I was asked to do a
presentation at my son's school for Career Week on analytics and data visualization. As part of the presentation, I asked the kids to complete a survey with their favorite color, movie, TV show, book, etc. I then created the following dashboard in Tableau for us to visualize the results.
For the kids in the presentation here is the link I promised to the
Pokemon visualization created by Jewel Loree
Just wish to say your article is as surprising.
ReplyDeleteThe clarity to your post is simply great and that i could
suppose you’re a professional on this subject.
Well with your permission let me to clutch your feed to stay up to date with approaching post.
Thank you a million and please continue the rewarding
work.
Tableau Guru
www.sqiar.com