Tuesday, April 11, 2017

Sergio Garcia captures his first major title at the 2017 Masters

In 1999, I went to the Byron Nelson Invitational golf tournament in Irving, TX and followed around a 19 year old golfer who was making his professional debut - Sergio Garcia.  Just a month earlier, I had watched Sergio take home the Silver Cup at the Masters Tournament for having the lowest score of any amateur. At the time, I was only a few years older than Sergio himself and I was fascinated with the joy and youthful exuberance he brought to the game.  In the first round of the Byron Nelson tournament, Sergio fired a 7 under par 63 and I immediately became a fan.

Later that year, the rest of the world saw the same excitement when Sergio battled Tiger Woods in the 1999 PGA Championship at Medinah Country Club outside of Chicago. Sergio came close to capturing his first major title that week, finishing in 2nd place behind Tiger.  The golf world thought he would become a potential rival to Tiger similar to what Jack Nicklaus had with Tom Watson or Lee Trevino.  No one at the time would have guessed that Sergio would come so close over the next 18 years finishing second 3 more times with 22 top 10 finishes and no major titles.  He would win tournaments - 9 on the PGA Tour and 15 on the European Tour.  He also became one of the key members of 8 European Ryder Cup Teams with an impressive 19-11-7 record.

I watched a large majority of the Masters this past weekend and saw a different Sergio.  He seemed more focused, mature and calm.  Not letting bogeys effect him the way it had in the past.  Instead of fading when faced with adversity, he fought back to win his first major title. 

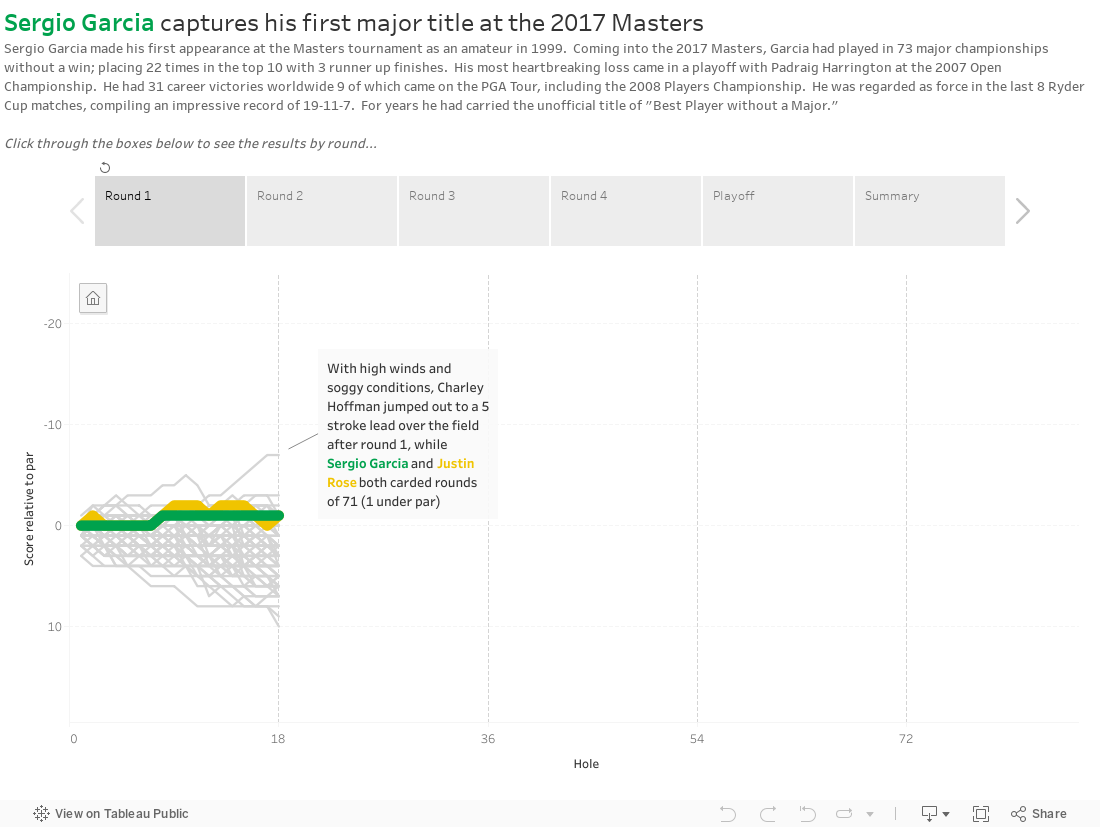
I created a similar visualization as part of a dashboard that I did after the 2015 Open Championship, but this time I wanted use it to tell the story of the 2017 Masters and his duel with Justin Rose.

Tuesday, March 28, 2017

Future Data Rockstar!

Last month my soon to be 9 year old daughter came home from school all excited about career day.  This year they could dress up as what they wanted to be.  I figured like most kids she would pick something like veterinarian, teacher, fire fighter, etc.  Not Maggie, she declared that she wanted to be a Data Rockstar like Dad!  I was so proud, but did she really know what a Data Rockstar does?


After we pulled together a super cool outfit with a custom Data Rockstar t-shirt, lanyard, Tableau Conference buttons and an awesome pair of glasses, we started talking about what data she might be interested in. I started showing her some of my previous visualizations and she landed on Deadpool.  She asked, "Why did you have to make a viz about a movie I can't see? You should make one with kid-friendly movies."

So we started with a list of her favorite animated Disney movies and I started gathering data. I showed her how to drag Dimensions and Measures out to the view and every time something changed it was "Wow! That was cool!" Who knew data viz could be so much fun for a 3rd grader?

She had a blast building the views and choosing the colors - she went with Jewel Bright of course. Like any other kid, she loved the idea of a lollipop chart.  I told her we could use Mickey icons instead of circles.  That might have been her favorite part.  That and the custom title image in Waltograph font.  She said it made it feel like Disney ;)

My favorite part? We pulled in the weekly box office gross and she said it didn't look right.  It was backwards from my Deadpool viz.  So I explained what a Running Sum was and walked her through adding the table calculation.  Not too many 3rd graders can rock a table calc!


We ended up with what might be my favorite viz so far, because of how excited she was when it was finished.