I started downloading some data and thought I would take a look at how good Mike Trout has been in his young career.
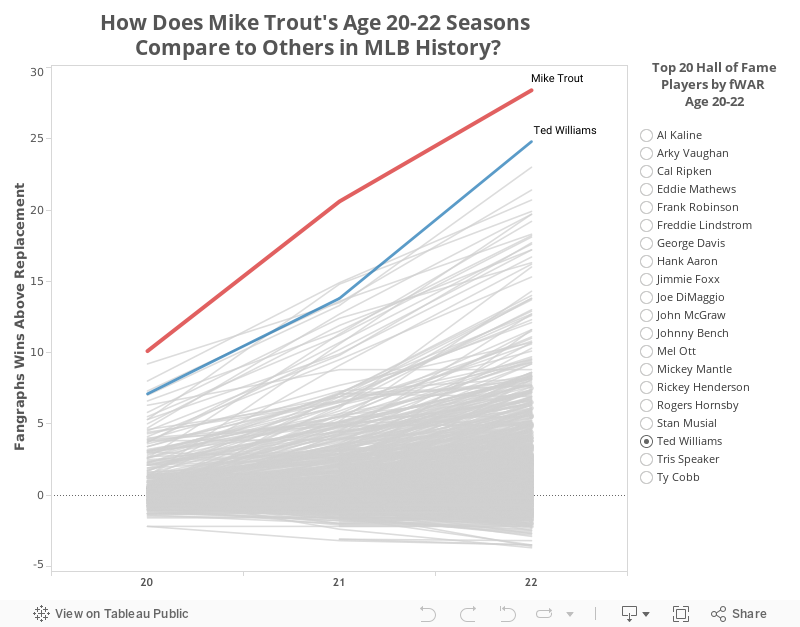
Fangraphs allowed me to pull the data by the player's age so I started with all the age 20-22 seasons in the history of baseball. Then, I wanted to see where Mike Trout's first 3 seasons fit, so I created a table calculation with a running total of the Fangraphs Wins Above Replacement or fWAR. This metric is a common tool to measure a player's overall impact into one statistic. It encompasses batting, baserunning and defense and compares it to a league average.
The visualization of just Mike Trout vs all previous Age 20-22 seasons was pretty insightful, but I wanted to add a little bit of interaction. I pulled a list of current members of the Baseball Hall of Fame from Baseball Reference, then created a set of the top 20 Age 20-22 seasons for Hall of Famers.

Once I had the set, I created a Parameter with the data

Now I could add the parameter control to the dashboard. I wanted to be able to highlight each of the players, but wanted them to all be one color and I wanted to show a thicker line when selected, so I created a couple of calculated fields - Highlighted Color and Highlighted Line


Then I dropped these fields on the Marks shelf for Color, Size, and Label...

Then update the colors...

And now we can highlight each Hall of Famer player and see how they compare with Mike Trout without losing the background data.
No comments:
Post a Comment