I love baseball and especially baseball history, so I wanted to focus a visualization on the past performance of MLB franchise performance. I have also wanted to try a "small multiples" visualization. I love the look of the NBA BALLCODE visualization by Peter Gilks over at Paint By Numbers, so I thought I would try something similar.
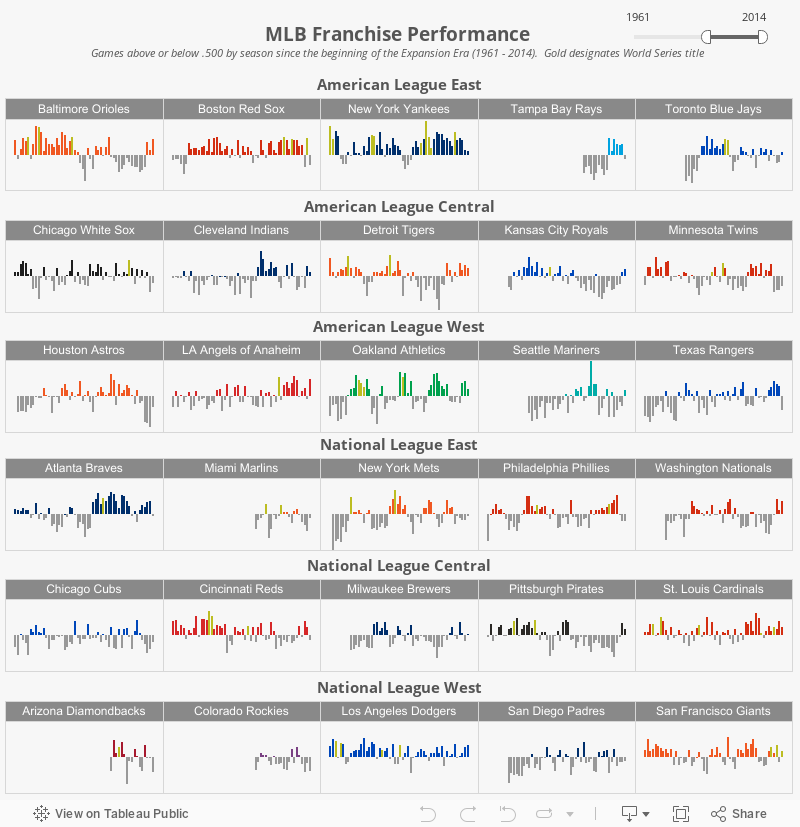
The viz below shows the performance of MLB franchises using games above/below .500. You can use the sliders to go back to the 1870's, but I decided to focus primarily on the Expansion Era beginning in 1961. I felt this was a good starting point since 4 teams were added over 2 years: Angels, Astros, Mets, and the new Senators (after the previous Senators became the Minnesota Twins). The league also expanded the number of games from 154 to the current 162.
I also wanted to add another dimension to the data, so I decided to change the team color to gold in seasons when the team won the World Series. This adds a good perspective to teams like the Yankees (especially if you move the slider back to the 1920s) and the Marlins (only 6 winning season, but 2 World Series titles).
Nice work Chris! I left you some feedback via #DataVizDoneRight http://www.datavizdoneright.com/2015/03/mlb-franchise-performance.html
ReplyDeleteHey Chris, thanks for the reference and great work. The gold for winning years is a really nice touch
ReplyDeleteA skilled hitter is a combination of laser-like focus, spring-loaded power, and gymnastic balance at the plate. axial sports
ReplyDeleteI love baseball too. Thank fightgearguide!
ReplyDeleteExcellent article. Very interesting to read. I really love to read such a nice article. Thanks! keep rocking. Explore a supernatural world and master the art of wizady in game sims 4 cheats : realm of magic. Coming on
ReplyDelete