I recently starting using
Tableau as a data visualization tool for work and just got back from the 2014 Tableau Conference. It was such an awesome week and I walked away with so many ideas. My favorite session was one on finding cool data and starting your own data blog. Big thanks to Jewel Loree from Tableau Public who hosted the session. Check out her awesome blog and vizzes
here. It inspired me to start my own blog and share some of my ideas with the world outside of work.
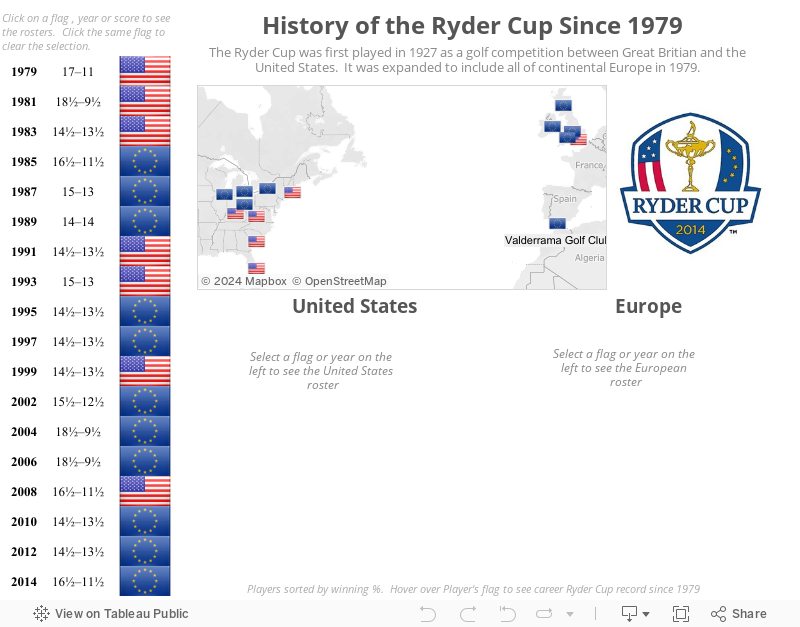
Since I love golf, I thought I would make my first visualization one about the history of the upcoming Ryder Cup.
I am not sure yet how frequently I will be posting. It may just depend on time and when I get ideas or come across interesting data.
Here it is. My first viz...
No comments:
Post a Comment