Friday, September 26, 2014

The Impact of Technology on PGA Tour Driving Distance

For this viz I really wanted to find something I could show using story points in Tableau.  I started looking at stats on the PGA Tour website and noticed that they had historical stats going back to 1980. That year, the leader on Tour was Dan Pohl at 274 yards. On today's Tour that would place 174th place, 40 yards behind the leaders!

What was the biggest contributor? Workout regimens have surely played a role as players are more dedicated to fitness and strength training, but Gary Player may have been the biggest workout fanatic in the history of the tour, and he never averaged 300+ yards off the tee.

The obvious answer is advancement in equipment.

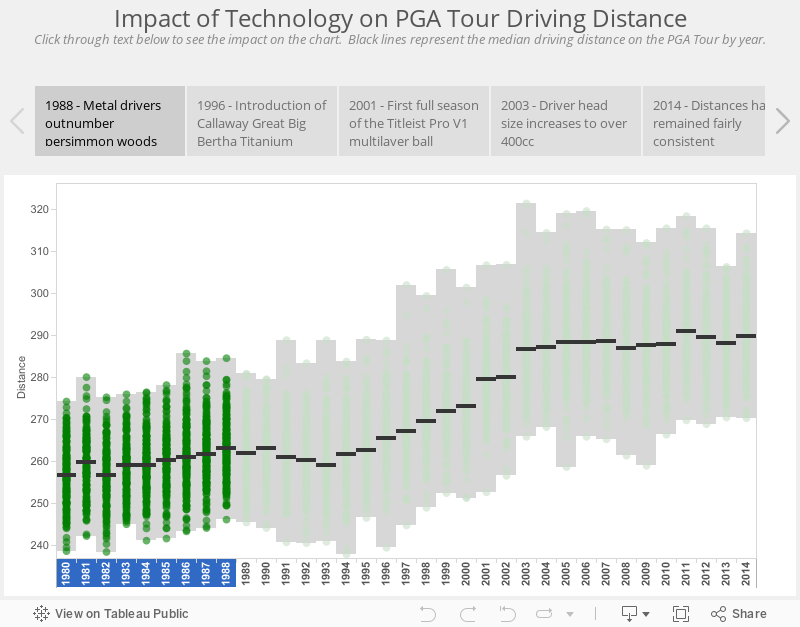
In 1980, players were using 43.5" persimmon drivers with steel shafts and balata balls. Todays drivers heads are nearly twice the size of persimmon, made of titanium, and have 45" graphite shafts. Not to mention the technology of today's multi-layer balls.

What advancement in equipment had the biggest impact?

There were two major advancements that contributed to the biggest change.  And they both occured within a 4 year span (2000-2003).  The first was the introduction of the multi-layer ball (Titleist Pro V1) and the second was the increase in driver head size to over 400cc.   The combination of these increased the median driving distance 5% or over 13 yards!

The increase in distance impacted players equally across the board. Corey Pavin has always been one of the shorter hitters on Tour (and happened to be one of my favorite golfers growing up). His average drive in 2000 was 258.1 yards. Just 4 seasons later in 2003 it jumped to 268.9 yards (an increase of 4.2%).  At the other end of the spectrum is John Daly.  Always one of the longest hitters on Tour, Daly went from 301.4 yards in 2000 to 314.3 yards in 2003 (an increase of 4.3%).

Friday, September 19, 2014

Top 25 PGA Tour Players

Since the PGA Tour season wrapped up, I thought I would take a look at the top 25 players on the money list through the end of the regular season and see how they ranked in key categories.

 A couple of things really jumped out when you look at the heat map below. Jimmy Walker has the worst Driving Accuracy on tour, yet finished 4th on the money list due to 3 wins early in the season and his strong putting.

In fact,  driving accuracy as a whole doesn't appear to be too important in regards to success on the PGA Tour, unless your name is Jim Furyk.

Furyk is one of the shortest hitters on the Tour and not a very good putter at this point in his career. However, he is one the the best ball strikers on tour, both off the tee and from the fairway. He also has one of the best short games with the fewest bogeys per round on tour.

Sunday, September 14, 2014

Ryder Cup

I recently starting using Tableau as a data visualization tool for work and just got back from the 2014 Tableau Conference.  It was such an awesome week and I walked away with so many ideas.  My favorite session was one on finding cool data and starting your own data blog.  Big thanks to Jewel Loree from Tableau Public who hosted the session.  Check out her awesome blog and vizzes here.  It inspired me to start my own blog and share some of my ideas with the world outside of work.

Since I love golf, I thought I would make my first visualization one about the history of the upcoming Ryder Cup.

I am not sure yet how frequently I will be posting.  It may just depend on time and  when I get ideas or come across interesting data.

Here it is.  My first viz...